EXPERIMENTAL: AN INVESTIGATION INTO THE RELATIONSHIP BETWEEN THE
CONCENTRATION AND THE CONDUCTANCE OF AQUEOUS SODIUM CHLORIDE

Introduction
Studies have shown that, in order to conduct electricity, a substance
must contain either free-moving electrons or free-moving ions; an ion
is either a charged atom or a charged group of atoms (e.g., ammonium
and hydrogencarbonate).  In the solid state, an ionic compound consists
of a lattice of oppositely charged ions which are not free to move
because they are held together by strong electrostatic attractions.
However, when an ionic compound is either melted or dissolved in water,
these ions are free to move, and so the electrolyte formed does conduct
an electric current.

Directly or indirectly, conductance is important in a variety of
scientific contexts; e.g., nerve impulses, electroplating, electrical
cells, and the extraction of metals by electrolytic reduction.

Quite reasonably, one might expect the conductance of an aqueous ionic
compound to be dependent on several independent variables, including
the concentration of dissolved compound ...
In this investigation, you are required to examine this hypothesis:
As the concentration (M) of sodium chloride increases, within the
range 0.00 - 1.00 mol dm-³, the conductances (C) of the aqueous
solutions increase in direct proportion; i.e., C = k × M. |
Method
1.  Using a measuring cylinder, measure out 100 cm³ of aqueous sodium
chloride (1.00 mol dm-³) into a clean beaker.
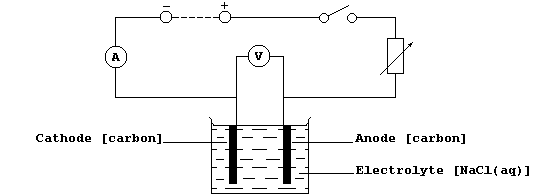
2.  Construct the circuit shown below, as follows: connect the series
part first, ensuring that the positive output (+) of the d.c. source is
connected to the positive input (+) of the ammeter ('red' to 'red');
then connect the voltmeter in parallel.
3.  Set the d.c. output source to a constant value (about 6 V ?).
4.  Close the switch, and immediately record the readings of both the
ammeter and the voltmeter; if a meter reads below zero, then the
polarities are reversed.
5.  Open the switch, and record the following values: temperature of
the solution; depth of the immersed electrodes; and distance between
the anode and cathode.  These values should remain constant throughout
the following step.
6.  Ensuring that you clean and dry the electrodes between each set of
readings, separately measure the current and voltage for the other
available concentrations and for appropriate duplicates.

Table of Results and Calculations
Constants: _________________________________________________________
____________________________________________________________________
____________________________________________________________________ |
 Concentration (M)
/ mol dm-³ |
 Current (I)
/ A |
 Voltage (V)
/ V |
 Conductance (C)
/ W-¹ |
|
|
|
|
|
|
|
|
|
|
|
|
|
|
|
|
|
|
|
|
|
|
|
|
|
|
|
|
[Conductance (C) = Current (I) ÷ Voltage (V)] |
Graphs
1.  Plot all the points of a well-labelled graph; i.e., complete with
units and with a precisely worded title.  Draw a best line through as
points as is sensible; and then determine whether, broadly speaking,
the graph is a straight line (go to 2), or a straight line and a curve
(go to 3), or a curve (go to 4).
2.  If the graph is a straight line, determine its gradient 'k' (which
has the units ohm-¹ mol-¹ dm³).  If this straight line passes through
the origin, then 'k' is the proportionality constant in the directly
proportional relationship C = k × M (valid for the concentration range
0.00 - 1.00 mol dm-³).
3.  If the graph is a straight line and a curve, determine the gradient
of the straight line portion; this value, 'k', is the proportionality
constant in the linearly proportional relationship C = k × M + c (valid
for the concentration range __________ mol dm-³).
4.  If the graph is a curve, then these two variables are not in simple
proportion to each other; i.e., C ‡ k × M + c (over the concentration
range __________ mol dm-³).

Notes (and Extension Work)
1.  The SI unit for conductance is the siemen (S), but the equivalent
unit of W-¹ is more commonly used (perhaps because it emphasizes
that conductance is the inverse of resistance).

2.  A graph shows direct proportionality between two variables, X and
Y, if it is a straight line that passes through the origin (i.e., X =
0.0 and Y = 0.0); mathematically, this direct relationship is expressed
as Y = k × X, where 'k' is the proportionality constant.

3.  A graph shows linear proportionality between two variables, X and
Y, if it is a straight line that does not pass through the origin; this
linear relationship is expressed as Y = k × X + c, where 'k' is the
proportionality constant, and 'c' is the intercept on the Y-axis.

4.  A graph shows no simple proportionality between two variables, X
and Y, if it is a curve; this absence of simple proportionality is
expressed either as Y ‡ k × X, or, more generally, as Y ‡ k × X + c.

5.  Complete this investigation, as follows.  First, after considering
the various sources of error, write a critical evaluation.  Second,
construct one or more precisely worded conclusions.  And third, suggest
a reasonable interpretation of the results.

6.  Many substances are classified either as 'ohmic' conductors or, if
their resistances change with voltage, as 'non-ohmic' conductors.
Consider planning (and executing) an investigation which examines, over
the voltage range 5 - 12 V, the ohmic characteristics of aqueous sodium
chloride (1.00 mol dm-³).

Dr. R. Peters                  Next                      Contents' List
