EXPERIMENTAL: AN INVESTIGATION INTO THE RELATIONSHIP BETWEEN THE HEAT
ENERGY RELEASED IN METAL DISPLACEMENT REACTIONS AND THE POTENTIAL
DIFFERENCES OBTAINED IN SIMPLE ELECTRICAL CELLS

Introduction
Chemically, a metallic element (M) is characterized by its tendency to
lose one or more electrons and form a positive ion; i.e., it is readily
oxidized (Olé!):       M ———————————® Mn+ + ne-
Quite reasonably, one might hypothesize that 'different metals will have
different tendencies to lose electrons and form stable positive ions'.
And, indeed, measured heat energy changes in displacement reactions and
potential differences in simple electrical cells, amongst a wide variety
of data, have provided convincing evidence to support this hypothesis.

All chemical and biochemical reactions involve an energy change; e.g.,
chemical energy may be transduced to electrical, kinetic, light, sound,
or (most often) to heat energy.  Chemical to heat energy changes occur,
for example, in displacement reactions such as:
         M(s) + Cu2+(aq) ————————————® Mn+(aq) + Cu(s)       (if M › Cu)
In such redox reactions, electrons are transferred from metal atoms to
copper(II) ions because the metal is more reactive than copper (i.e.,
the metal is more easily oxidized); the redox half equations are:
                    M(s) ———————————® Mn+(aq) + ne-         (oxidation)
           Cu2+(aq) + 2e- ———————————® Cu(s)                (reduction)
Chemical to electrical energy changes occur, for example, in simple
electrical cells; thus, using the apparatus shown below, a potential
difference (V) is observed if the metal (M) is more or less reactive
than copper.

[.. Ca > Mg > Al > Mn > Zn > Fe > Co > Ni > Sn > (H) > Cu > Ag > Pd ..]
In this investigation, you are required to examine two relationships.
First, that between the metal reactivity series & the heat energy (H)
released in metal displacement reactions involving aqueous copper(II)
sulfate. And second, that between the heat energy (H) released & the
potential differences (V) observed in simple electrical cells of the
type metal/copper (M/Cu); in particular, whether H = k × V. |
Method
1.  Using a reference thermometer, measure room temperature.
2.  Using a bulb-pipette equipped with a safety-filler, or a burette,
or a measuring cylinder, place 25.0 cm³ of aqueous copper(II) sulfate
(0.200 mol dm-³) into an insulated plastic cup; then measure the
starting temperature of the solution to at least the nearest 0.2°C.
3.  Add a slight excess of zinc powder to the cup; boldly, but gently,
stir the mixture; and then measure the highest temperature reached.
4.  Record any changes in the reaction mixture; e.g., the colour of the
solution and of the (precipitated) solid.
5.  Ensuring that the cup is clean, and that both the insulation and
the cup are dry, repeat steps 2 to 4 for the duplicates of zinc, then
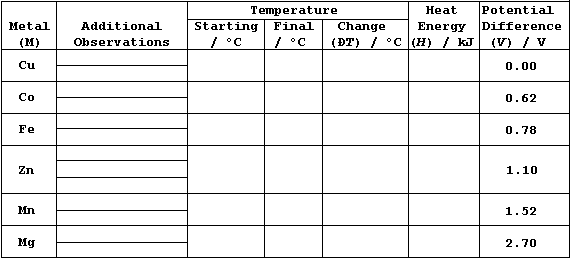
the control (copper), and finally the other metals listed in the Table.
6.  Using the reference thermometer, re-measure room temperature.

Results and Calculations
Constants: ____________________________________________________________
_______________________________________________________________________
_______________________________________________________________________

1.  Potential difference data (V), for M/Cu, have been edited from
values compiled by A. J. Bard et al. (Standard Potentials in Aqueous
Solutions, Marcel Dekker, New York, 1985).
2.  The heat energy released from a chemical reaction can be determined
by first measuring its temperature change, and then using the equation
H = m × c × DT, where: H is the heat energy released; m is the mass of
substance; c is its specific heat capacity; and DT is the temperature
change.
3.  If the mass of 25.0 cm³ of aqueous copper(II) sulfate is assumed
to be 0.025 kg, and if its specific heat capacity is assumed to be the
same as that of pure water (i.e., 4.2 kJ kg-¹ °C-¹), then the above
equation simplifies to: H = 0.025 × 4.2 × DT.

Graphs
1.  Plot well-labelled bar graphs of these data: one dependent variable
(H) should be a linear scale on the left vertical axis, the other
dependent variable (V) should be a linear scale on the right vertical
axis, and the independent variable should be on the horizontal axis
(with each metal as a separate block); use one block for zinc, with its
average value for H obtained either from all three results, if they are
acceptably close together, or from the two closest results.
2.  Plot all eight points of a well-labelled line graph of these data;
consider the dependent variable to be heat energy released (H) and the
independent variable to be potential difference (V).  Draw a best
straight line through the origin and as many points as is sensible, and
then determine its gradient; this value, 'k', is the proportionality
constant in the directly proportional relationship H = k × V.

Sources of Error and Conclusions
Complete this investigation, as follows.  First, after considering the
various sources of error (i.e., systematic, random, and design), write
a critical evaluation (and, perhaps, include one or more suggestions as
to how the errors could be minimized).  Second, after considering the
errors, the two bar graphs, and the line graph, construct one or more
precisely worded conclusions.  And third, predict how much heat energy
(H) would be released (if any) for the reactions of calcium, nickel,
and palladium with aqueous copper(II) sulfate - using, in part, these
data: Ca/Cu = 3.20 V; Ni/Cu = 0.58 V; and Pd/Cu = -0.65 V.

Dr. R. Peters                  Next                      Contents' List

